
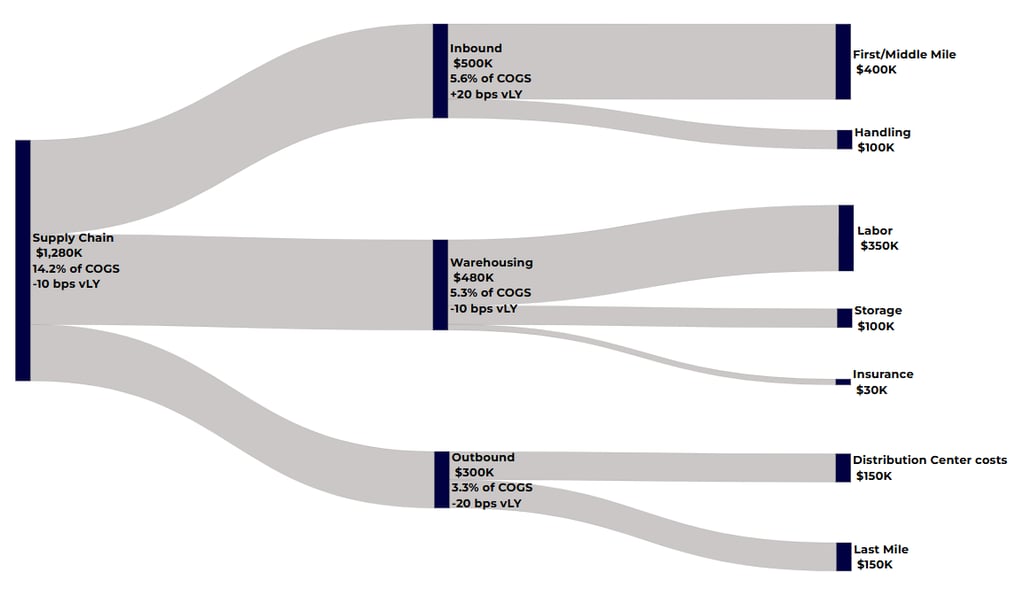
Supply Chain
Sankey Charts are well-suited to break down costs into various components.
For example, instead of listing various costs in a table, you can use a Sankey Chart to bring dynamism and originality to your presentation.
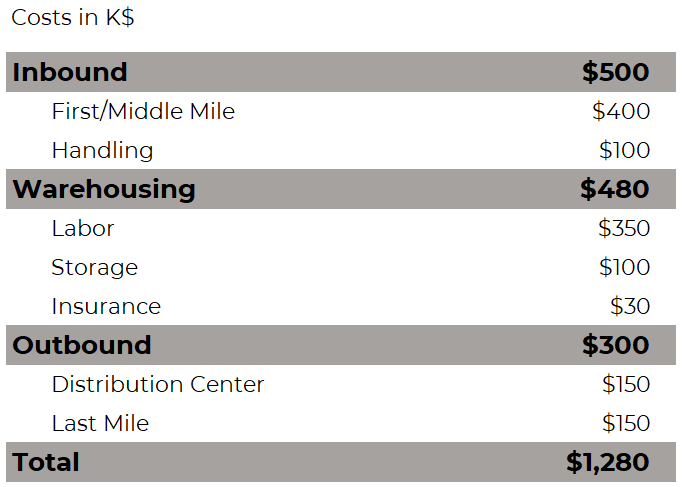
Costs table
Costs split with a Sankey chart
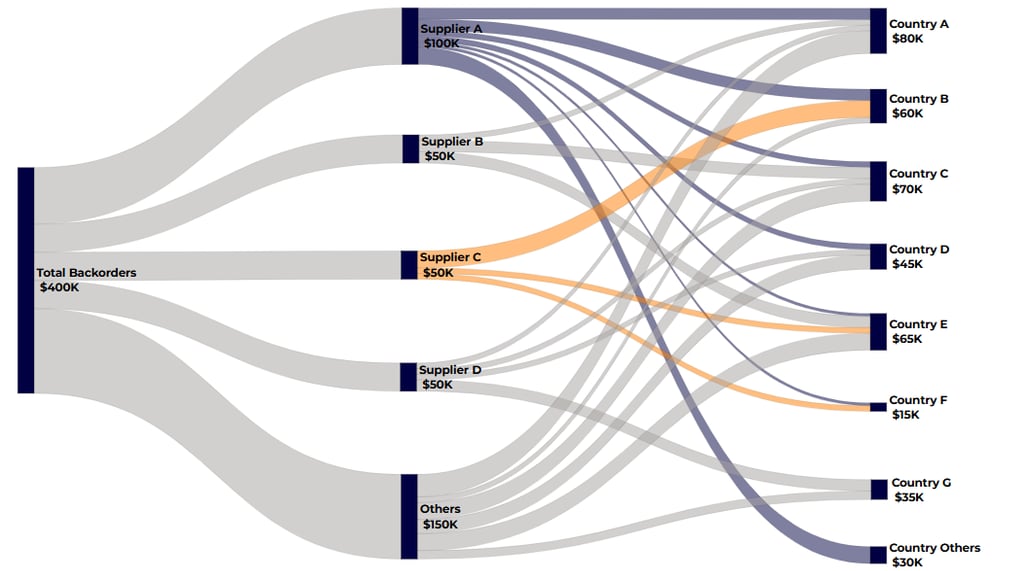
As another example of Sankey charts utilization, see below backorders by suppliers and countries.

Sankey chart (Exhibit B)
Backorders